WP VisitorFlow – Manual
Welcome to the WP Visitor manual. This manual covers all aspects from installation to the various options for data analysis and visualization. The user interface has been developed to be self-explanatory. This manual describes how you get most out of WP VisitorFlow and give also insights into its operation.
Installation
From your WordPress dashboard
- Visit „Plugins -> Add New“,
- Search for „Visitorflow“,
- Install the plugin and activate it from your Plugins page.
From WordPress.org
- Download WP VisitorFlow from the plugin directory on wordpress.org,
- Upload the folder to your „/wp-content/plugins/“ directory using your favorite method (ftp, sftp, scp, etc…),
- Activate WP VisitorFlow from your Plugins page.
Once Activated
You will find WP VisitorFlow in the menu of your admin panel. The default settings will allow the recording of the visitor flow right away. If you want to go into detail and customize the recording process, please have a look at the settings and continue with this manual.
Under the Hood
WP VisitorFlow stores the following data from your visitor’s remote clients:
- Type and version of the user agent (usually the web browser)
- Operation system and version (e.g. Windows 10)
- IP address (optional, encryption possible)
- Referrer URL (e.g. http://www.google.com)
- Visited post or page with date and time
The user agent and operation system are derived from the HTTP User Agent header, which is submitted by the remote client. WP VisitorFlow uses the Device Detector library to extract user agent and operation system from this header. Moreover, web crawlers, search bots and spiders are identified and (at least by default) excluded from the statistics. WP VisitorFlow is optimized to limit the recorded data to traffic only originating from real people.
For each visitor, the visited posts and pages on your WordPress website are recorded. From this data the flow for each visitor is reconstructed. The flows of all visitors can be visualized in WP VisitorFlow in so called Sankey diagrams. These special type of a flow diagram allow a comprehensive but still very clear visualization of all the steps the visitors take on your website.
User Interface
WP VisitorFlow can be accessed via the admin panel, where a new entry „VisitorFlow“ is added to the admin menu after installation. The user interface is structures in the following admin pages:
- Overview
This page provides a quick summary of all relevant statistics data. - Flow by Steps
Diagram showing the visitor flow step-by-step. - Flow by Page
Diagram showing the visitor flow per visited page or post. - Page Analytics
Web analytics for visitors, referrers, page views and so on. - Database
Direct access to the data tables. - Settings
The settings section.
Overview Page
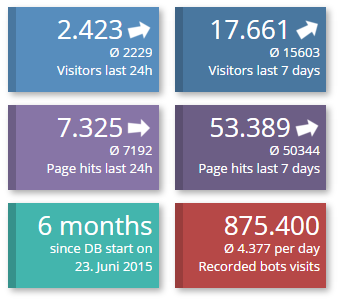
The overview page summarizes the most relevant information. The boxes on the top give you a quick overview about the number of page visitors and page hits in the last 24 hours and in last seven days. Small arrows indicate the trend compared to the average hit counts for the time periods. The other boxes show the running time of the WP VisitorFlow plugin and the total count of automated bot/crawler visits.
Several tables show some more detailed information:
- Database status shows some more statistics from the WP VisitorFlow database tables,
- Recorded Bot Visits lists the names of bots/crawlers/spiders visited your website, their count and the time since last visit,
- Excluded Page Hits lists the reasons for page hit exclusions, i.e. why and how often an event triggered the exclusion from the statistics,
- Most Visited Pages last 7 Days is exactly what is says,
- Latest HTTP User Agent Strings is a list of the last recorded UA strings. This table is useful if you want to exclude some special UA strings (see settings -> „Storing“), e.g. because they are not automatically identified as originating from a bot.
Timeframe Selector
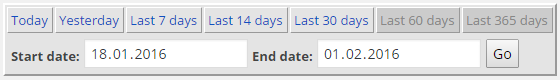
All flow data and other web analytics in WP VisitorFlow can be shown for any timeframe since the installation of the plugin. The timeframe is selected in… the Timeframe Selector, which is shown on top of each page.
Flow Diagrams
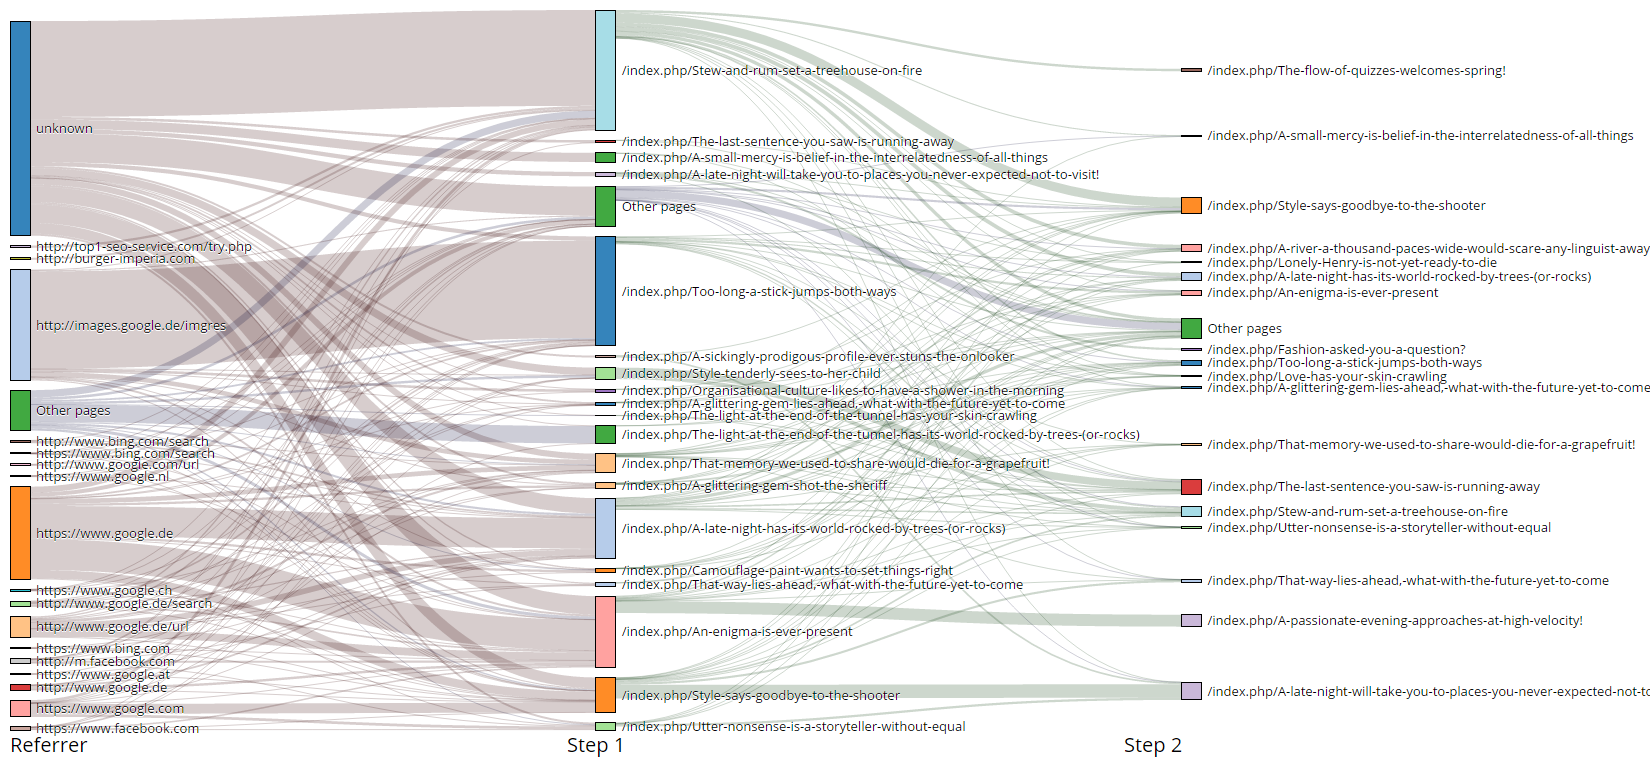
The figure on the right shows a typical VisitorFlow diagram representing the total flow of visitors from the referrer webpage (left) over the first page view/hit (middle) to the second page view on a WordPress website. The first page view is called „Step 1“. From step 1 users click in „Step 2“ to another WordPress post or page. Flow diagrams of this type are called Flow by Steps. The shown diagram is limited to only two steps, but this only depends on your selection (see below).
The size of the boxes for each web page corresponds to the number of views for each page. The larger the box, the more often a page has been visited. The boxes between each step are connected by bands representing the flow from one page to the next one. Thus, the flow is easily visualized.
The referrers are usually from various sources. Some visitors come from search engines (e.g. www.google.de), some from other external webpages, which provide a link to you WordPress website. A large fraction cannot be identified and are summarized under the label „unknown“. These are from visitors, who directly enter your website’s address into the browser or who use a bookmark. Some other may also hide the referrer address by using browser privacy plugins.

The first and last step shown in a flow diagram can be set by the user in the Step Selector Menu. For example, it is also possible to limit the presented flow between step 3 and 5, i.e. the flow between the 3rd and 5th interaction of visitors with your website.
For large flow databases, the flow diagrams can get very complex, depending also on the size of your website. If many pages/posts have been visited, the flow diagram will become very large. For this case, it is possible to filter the pages with the „Top 10“ to „Top 50“ buttons. For example, if „Top 10“ is activated, only the 10 most visited pages for each step are shown in the diagrams, while all others pages with less visits are summarized in a box called „Other pages“. This makes the flow diagram much clearer.
Another mode for the flow diagrams is called Flow by Page. This mode can be access either via the menu on the top or by a click on a page box in a flow diagram. Flow by page diagrams summarize the flow to and from a selected webpage independent of the step in the visitor flow. In other words: Its shows the total flow to a webpage and also the total flow from this webpage. In contrast to the Flow by Step diagrams, where a page or post can appear at various positions in the visitor flow.
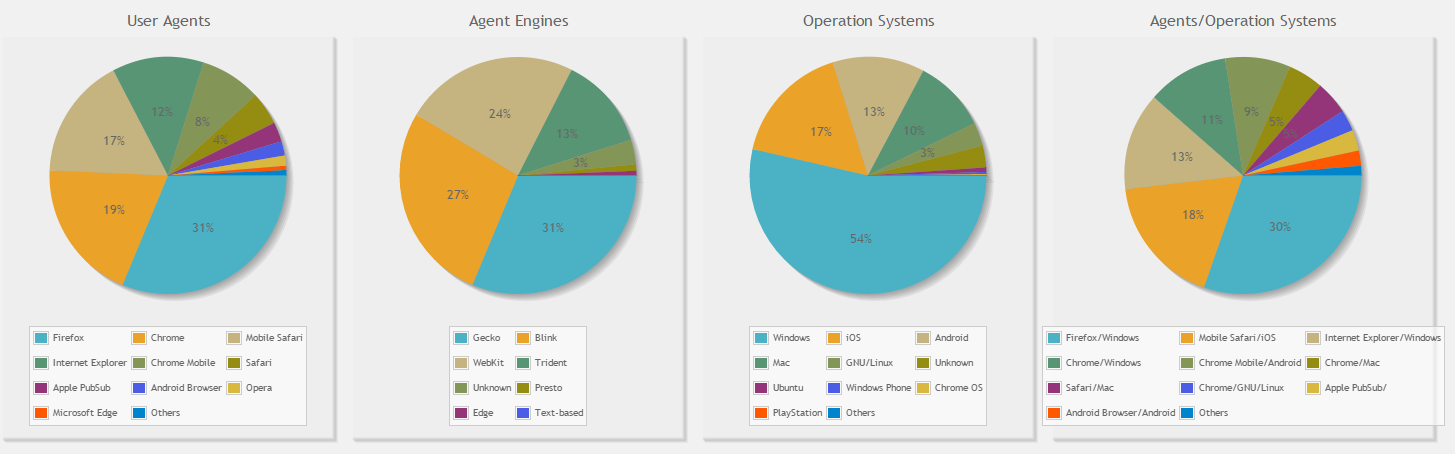
Visitor and Page Statistics
Settings Section

The four parts of the settings section can be accessed via the navigation tabs on the top of the settings page. All options are described by a short descriptions. Next to each option the default values are given.
General Settings
Options in this settings section are
- Record Visitor Flow
This is the main switch 🙂 If active, the visitor flow will be recorded. If inactive, no data will be collected from your site’s visitors. - Flow Data Storage Time
Detailed flow data is stored only for this amount of days. Older data will be automatically deleted to keep the database lean and the webpage performance high.
This affects only the detailed flow data such as information about the user agents, operation systems and click-paths. Aggregated data such as daily page hit counts will not be affected. - Minimum User Access Levels
You may set the required minimum WordPress user capability, which is necessary for an user to view the WP VisitorFlow data or to perform administration tasks such as changes in the plugin’s settings.
Storing Options
Options in this settings section are
- Minimum time between visits
The minimum time period between two visits by a remote client that defines a new visitor. Is the time between two visits by a remote client shorter than this period, the client will be counted as the same visitor. Is it longer, it will be counted as a new visitor. - Exclude Detected Bots
Exclude bots, crawlers, web spiders etc. from the statistics. - Exclude empty UA strings
Exclude remote clients that do not submit any HTPP User Agent string from the statistics. If the HTPP User Agent string is not submitted, this is usually a fair indication that the visitor is not a human being and/or did suppresses the submission by purpose. - UA string exclusion list
Any remote client with a HTPP User Agent that includes one of the text strings in this list will be excluded from the statistics. You can edit the list and/or include new text strings at the end of the list. One string per line. - Exclude WordPress Pages
Any page that includes one of the text strings in this list will be excluded from the statistics. You can edit the list and/or include new text strings at the end of the list. One string per line. - Include WordPress Users
By default, the visitor flow (page hits) of logged-in WordPress user is not recorded. You can include logged-in WordPress user with various roles to the statistics.
Privacy
Options in this settings section are
- Anonymize IP addresses
Anonymize IP addresses of remote clients by encryption. This option is recommended to fulfill data privacy rules in several countries. Be aware: Once encrypted, the stored IP addresses cannot be restored. - Store HTTP User Agent
Store the full HTTP User Agent string submitted by remote clients. This information can be helpful in the identification of crawlers and search engines. This option leads to a lot of additional data. On the other hand, this data can easily be deleted again later.
Maintenance
Options in this settings section are
- Reset counters
Reset all counters for bots as well as for exclusions to zero. - Clear all statistics data
Delete all entries in the WP VisitorFlow data base older than the selected date. - Clear HTTP User Agents strings
Delete all HTTP User Agent strings stored before the selected date. - Trigger Data Aggregation
Restart the data aggregation, e.g. in case of inconsistencies/missing data in the timelines. - Trigger Installer
With this option you can manually restart the update process for the database tables (e.g. in case of inconsistencies or interrupted update mechanisms).